
Food Compare at a Glance
Food Analysis
Food Compare contains more than 300 food items that have been manually selected and added to the web project. The USDA has served as our primary resource, which provides the world-largest nutrient database.
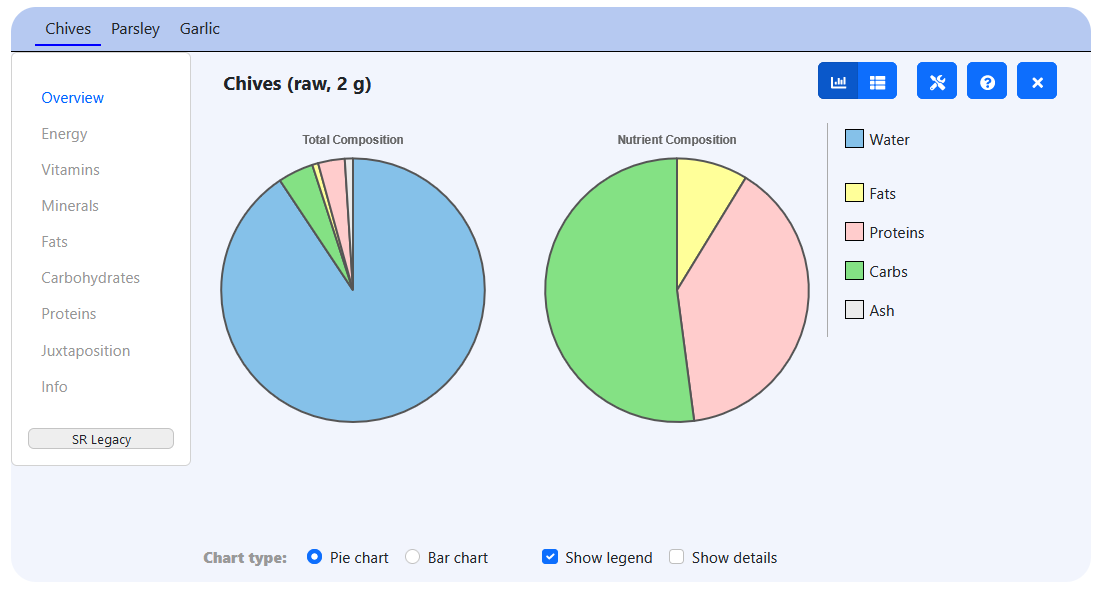
The application allows to pick and display multiple food items. They can be selected using a category tree as well as a text entry field. Many food items come with different sub-types, such as different conditions (raw, boiled, roasted and the like). The portion size is individually configurable, though typical portion sizes are usually pre-selected.
Food items will be displayed in separate data tabs. The data panel comprises several sections that contain separate pieces of informationen, such as the total nutrient composition, energy amount, vitamins, minerals, fatty acids and the like. For a better understanding, data about vitamins, minerals and proteins is displayed in relation to the daily requirements. For instance, an average apple covers about 7 % of the daily requirement of Vitamin C.
Although Food Compare has been developed with focus on graphical illustration, the analysis panel also allows to switch to the table mode in which food data is traditionally displayed. If available, the amounts of daily requirements will also be displayed in this mode.
Composite Food Data
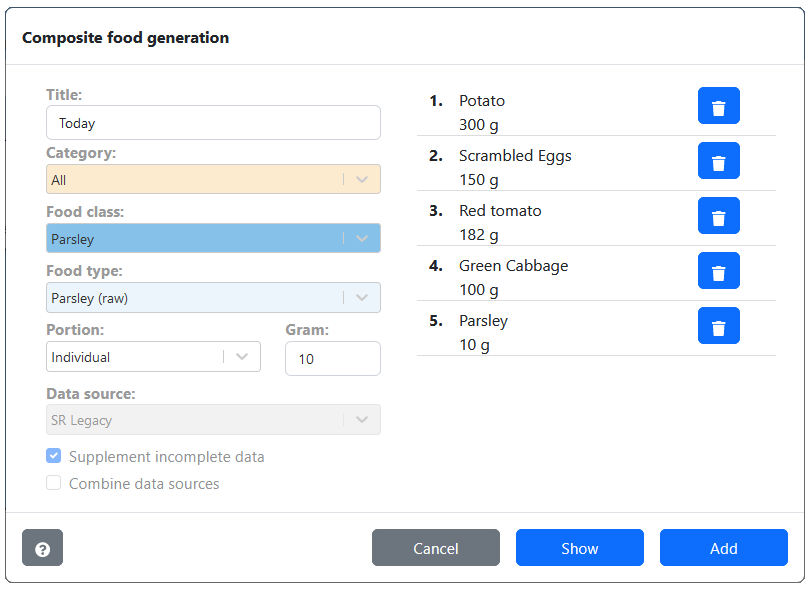
Additionally, Food Compare allows to combine different food items to composite food elements. This feature seems useful for people who are interested in the composition of menus consisting of different foods, or who want to determine the total amount of nutrients they consumed within a specific time, like a day.
In order to create a composite food, click the stack button on the food analyze page and add food items to your composite list. Individual portion sizes can be set. Once you have clicked the show button, the composite food will be added to the food data panel as a new tab. The data you will see is total amount of nutrients, vitamins and minerals in your menu. For correctness, nutrient data that is not provided by each of the selected foods will not be displayed.
Direct Comparison
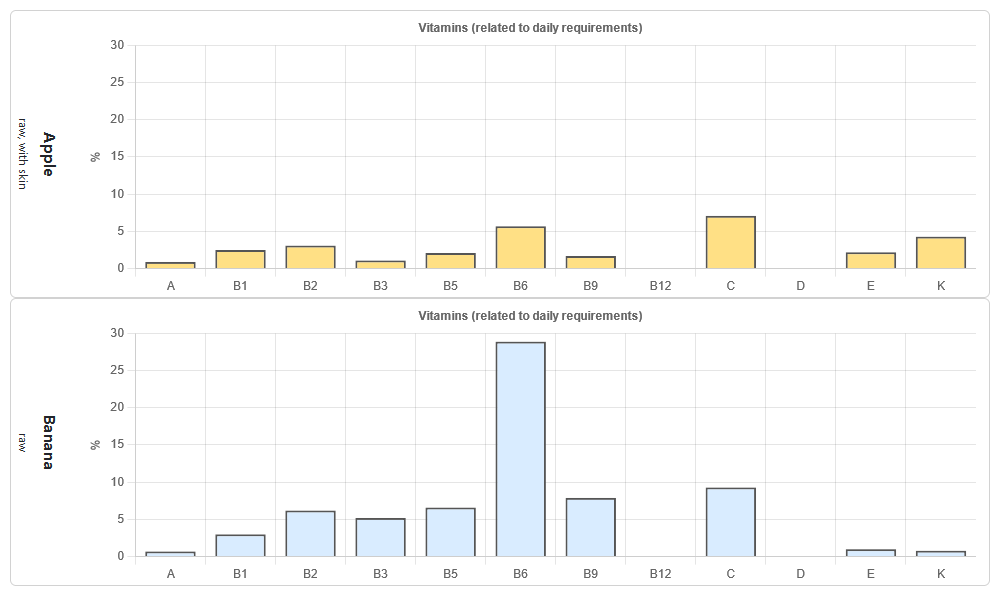
For the juxtaposition of food data between two food items, the direct comparison page allows to pick two foods and compare the data with each other. This enables you to see and compare the nutrient composition or vitamins of two foods on one glance. Some data pages also allow to synchronize the charts, which means that they are scaled the same way. Synchronizing charts helps to easily compare food data between two foods.
Examples for direct comparison:
Ranking of Food Elements
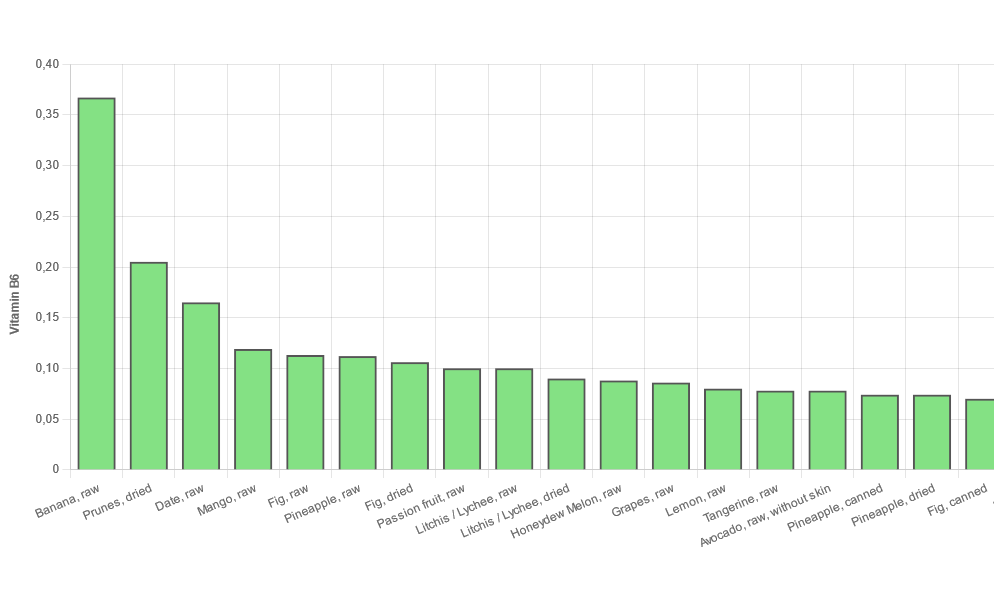
Food Compare also allows to rank foods by a certain value, such as a specific vitamin or nutrient. The resulting chart will show those food items of the Food Compare database containing the largest amount of that value in descending order. Either all food items of the application can be taken into account or just those of a specific category. Additionally, users can distinguish between the standardized 100 gram portion sizes or the default portion sizes used in the application.
The ranking menu is especially useful for people that are looking for foods covering a particularly high amount of a specific nutrient, vitamin or mineral. Those may, for instance, people being on a certain diet.
Juxtaposition of Food Elements
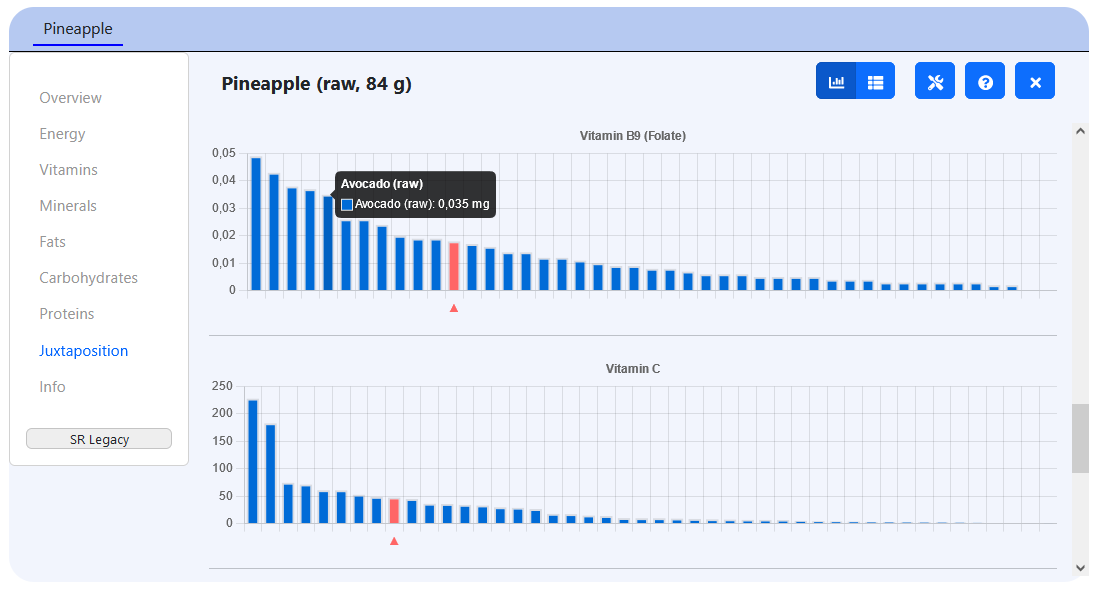
The analysis panels contains a view to show how a value of a selected food correlates to other foods in Food Compare, for example, whether this food contains an unusual high or low amount of the specified ingredient. The selected food can be put in relation to all the other food elements of its food category, or to all the other food elements of the whole Food Compare database. In case that multiple food tabs have been opened, the selected food can also be compared to the other elements of the analysis panel.
By contrast, the table mode of the juxtaposition view shows the minimum, maximum and average value of the ingredient across all food elements.